Edtech & gamification case study
RGAME
Integrating an educational game into school curricula: turning classroom adoption, teacher buy-in, and gamified engagement into a measurable rollout across real educational institutions.
School rollout
Gamified learning
Teacher enablement
Impact targets
The launch needed more than installs
The original case set clear adoption and engagement goals, then validated them with retention, satisfaction, and pilot feedback once the product reached real schools.
Reached in the first 3 months, exceeding the original 1,000-user target by 50%.
The average time children spent in the product grew beyond the planned +20% target.
Day 7 and Day 30 retention stayed above educational app averages after the launch.
Teachers reported strong sentiment, while student CSAT reached 4.5 out of 5.
Challenge
A game is not enough if the school cannot adopt it
The product promise was compelling, but integration into real educational processes demanded a clearer operating model than a purely entertainment-first app would need.
Modern educational institutions were looking for more interactive and engaging learning formats, yet most classroom routines still relied on passive materials. The challenge was to embed a team-based educational game into school curricula without making teachers or administrators take on extra operational friction.
- Students needed stronger engagement and clearer progress feedback.
- Teachers needed lightweight classroom setup and automated support.
- Administrators needed evidence, reporting, and standards compliance.
The work combined product strategy, research, prioritization, UX design, and launch support. Instead of polishing isolated screens, the case focused on three connected systems: curriculum fit, gamified student motivation, and a rollout model teachers could actually sustain.
- Use Customer Development to surface pains across all stakeholder groups.
- Prioritize features with MoSCoW and RICE instead of growing the scope blindly.
- Validate classroom viability through pilots, onboarding materials, and analytics.
Process
From discovery to school rollout
The original page outlined a five-stage delivery path: market research, product improvement, launch preparation, go-to-market, and analytics. Here it is organized into a cleaner flow while preserving the same work logic.
High-level flow
The role combined strategy, research, design, delivery coordination, and launch support rather than stopping at a single UX deliverable.
Research
Prioritise
Prototype
Launch
Measure
01
Research
Interviews, surveys, competitor benchmarking, and educational context mapping.
02
Prioritise
MoSCoW, RICE, personas, and backlog shaping around classroom value.
03
Prototype
User scenarios, wireframes, Figma prototypes, gamification mechanics, and UX testing.
04
Launch
Pilot schools, teacher materials, stakeholder training, and go-to-market support.
05
Measure
Amplitude, Google Analytics, retention, cohort analysis, NPS, and CSAT.
Market research and analysis
Use customer development and market comparison to understand where a school-facing educational game can actually win.
- Conduct interviews with school administrators, teachers, and parents.
- Survey students at scale to identify preferred mechanics and attention triggers.
- Create a SWOT comparison of direct and indirect educational competitors.
- Translate findings into initial personas and opportunity areas.
Product development and improvement
Move from discovery into product structure: what the experience should include, how it should work, and what gets built first.
- Prioritize the backlog with MoSCoW and RICE.
- Design user scenarios, wireframes, and clickable prototypes in Figma and Miro.
- Implement gamification elements like badges and difficulty levels.
- Ensure the solution stays aligned with educational standards and teacher routines.
Pilot and product refinement
Use real classroom conditions to validate whether the product works as a teaching tool, not just as a concept.
- Run Agile / Scrum sprints with two-week iterations and regular team reviews.
- Prepare methodological materials for teachers and onboarding guides for students.
- Pilot the product in 5 schools, covering about 300 students.
- Use qualitative and in-product feedback to refine mechanics before a wider launch.
Go-to-market and launch
Prepare the product and the surrounding rollout materials so schools can adopt it with less resistance.
- Develop demos for school administrators and teachers.
- Create PDF guides, video tutorials, and online seminars via Zoom.
- Coordinate marketing focused on educational value instead of generic product noise.
- Work with partner channels, blogs, and school stakeholders to support activation.
Metrics and analytics
Track whether the rollout is producing real learning-product behavior, not just early curiosity.
- Monitor DAU/WAU, completed tasks, and average time spent in the app.
- Use Google Analytics and Amplitude to track growth and retention cohorts.
- Run A/B(/C) testing to validate interface and game mechanic changes.
- Capture NPS and CSAT through built-in surveys and post-pilot interviews.
Research
What the research actually uncovered
The case was built on mixed research: stakeholder interviews, student surveys, competitor analysis, and practical questions about what schools can realistically adopt.
Research base
The evidence combined classroom stakeholders, product framing, and direct behavior signals.
10
Interviews with school administrations.
15
Teacher interviews about lesson fit and platform workload.
20
Parent interviews about trust, value, and home usage.
200+
Student survey responses on game mechanics and engagement.
Customer Development
Google Forms
Excel & Pivot Tables
SWOT analysis
Personas
Benchmark analysis
Core takeaways
The strongest signal from the research was that adoption depended on different value stories for each audience. The product needed to be fun for students, practical for teachers, and accountable for school leadership.
Students wanted challenge and visible rewards
Mini-games, quizzes, achievements, and friend-based competition drove attention far more than static content.
Teachers wanted easier operations, not extra complexity
Automated checking, individual assignments, and low-friction setup mattered more than flashy novelty alone.
Administrators cared about proof and standards
Reporting, performance analytics, and compatibility with educational requirements were essential for rollout approval.
The product needed a full operating model
Guides, teacher enablement, pilot support, and analytics were as important as the student-facing interface itself.
Personas
Three audiences shaped every product decision
The original case documented detailed profiles for the student, the teacher, and the administrator. In the rebuild, they stay central because the product was never serving only one user type.
Student, Ivan
12 years old, 6th grade, smartphone and tablet user.
Goals
Improve academic performance, enjoy learning through challenge, and earn visible rewards that can be shared with friends.
Pains
- Boring lessons and monotonous tasks reduce motivation quickly.
- Hard topics need more explanation and repeatable practice.
- Attention drops fast when the product is not interactive.
Behavior
Uses the app 3 to 4 times a week, especially after school, and responds best to mini-games, quizzes, and challenge loops.
Teacher, Maria
Math teacher, 15 years experience, confident with classroom tech.
Goals
Make lessons more interactive, monitor progress easily, and introduce modern teaching tools without increasing admin load.
Pains
- Fear that setup will take too much time.
- Concern about technical failures and lack of support.
- Overload from too many disconnected education tools.
Behavior
Uses the product in lessons 2 to 3 times a week and values automated checking plus tailored assignments most.
Administrator, Alexey
Deputy director for academic affairs with reporting and rollout responsibilities.
Goals
Improve the educational process with digital tools, access reliable reporting, and keep the rollout aligned with standards.
Pains
- Budget constraints make risky implementations harder to justify.
- Teachers may resist unfamiliar workflows.
- Integration with existing systems can become a blocker.
Behavior
Checks statistics weekly or monthly and values performance dashboards, engagement reports, and low-friction administration.
Benchmark
What the market read taught the team
The case included a SWOT comparison against established education platforms. The goal was not to copy one competitor, but to identify where classroom-oriented gamification and school rollout could become a differentiated product story.
Competitive landscape
The benchmark covered large educational brands, online schools, and public educational platforms to understand their strengths, blind spots, and opportunity gaps.
Strong subject coverage and adaptive tasks, but less emphasis on deeper game dynamics.
High-quality educational content and exam prep, but less interactivity and higher purchase friction.
Personalized lessons and flexibility, though the model is less aligned with school-wide rollout.
Institutional legitimacy and free access, but slower adaptation to modern engagement patterns.
Broad learning archive and expert-led materials, but weaker classroom interactivity.
Blend curriculum value, team-based play, teacher enablement, and measurable school adoption in one product story.
SWOT synthesis
The benchmark translated market observations into a product strategy lens that could guide scope, positioning, and rollout decisions.
Gamified format, teamwork mechanics, and differentiated engagement potential inside school learning.
Implementation complexity, limited initial trust, and the need to align with educational workflows and standards.
Partnerships with schools, better mobile accessibility, and stronger game loops to raise student motivation.
Fast-moving educational platforms, budget constraints, and shifting requirements around school-approved content.
Artifacts
The visuals that anchored the original story
The export carried a mix of case screenshots and delivery artefacts. Here they are used as a cleaner visual strip to keep the page readable while preserving the original proof.
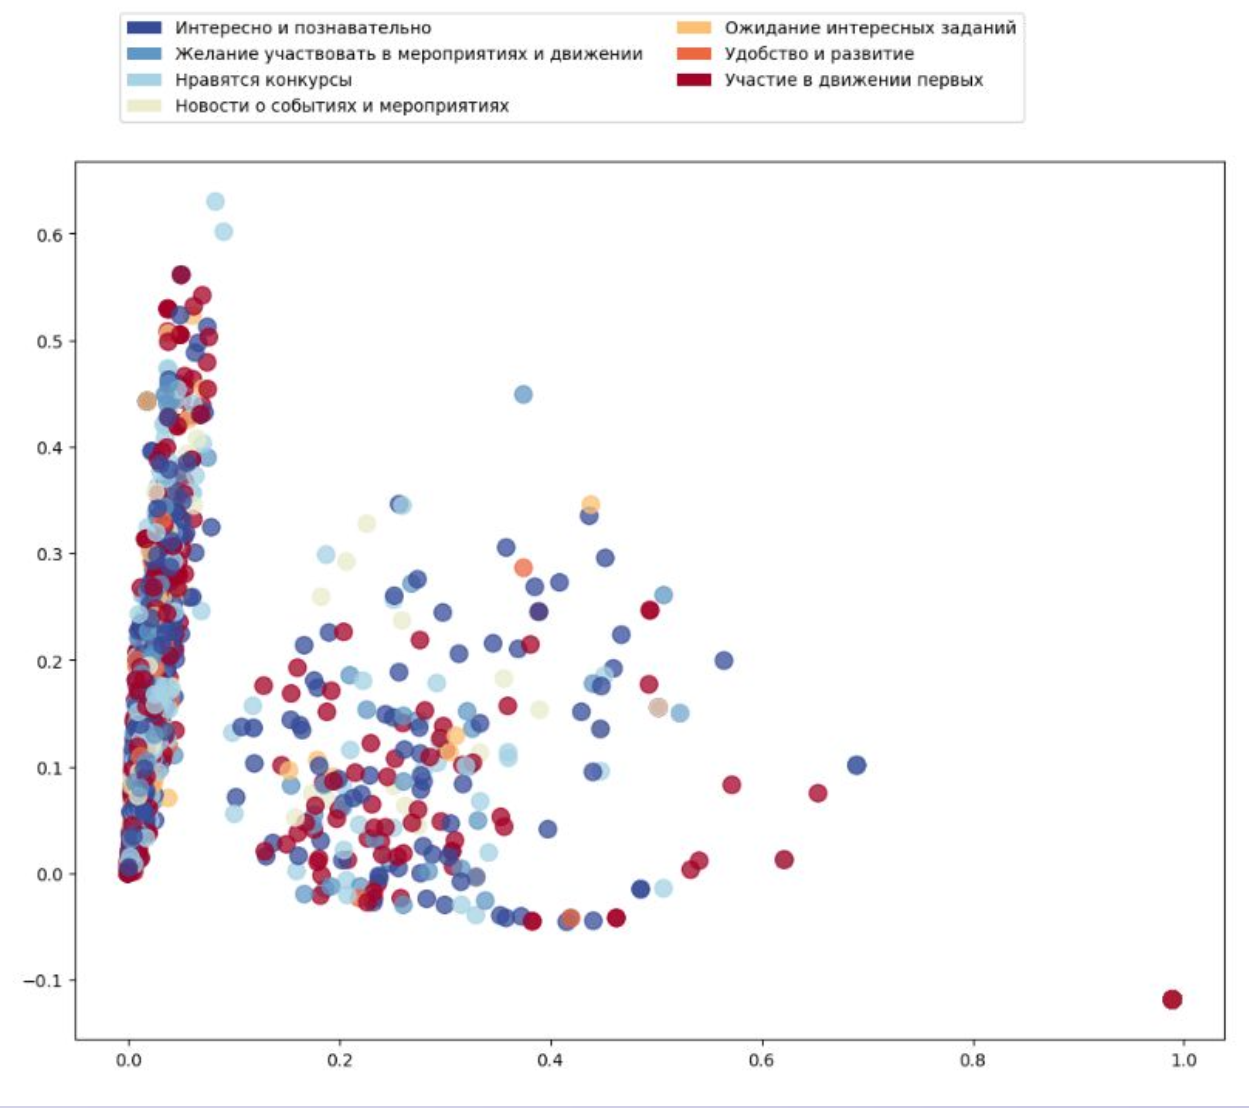
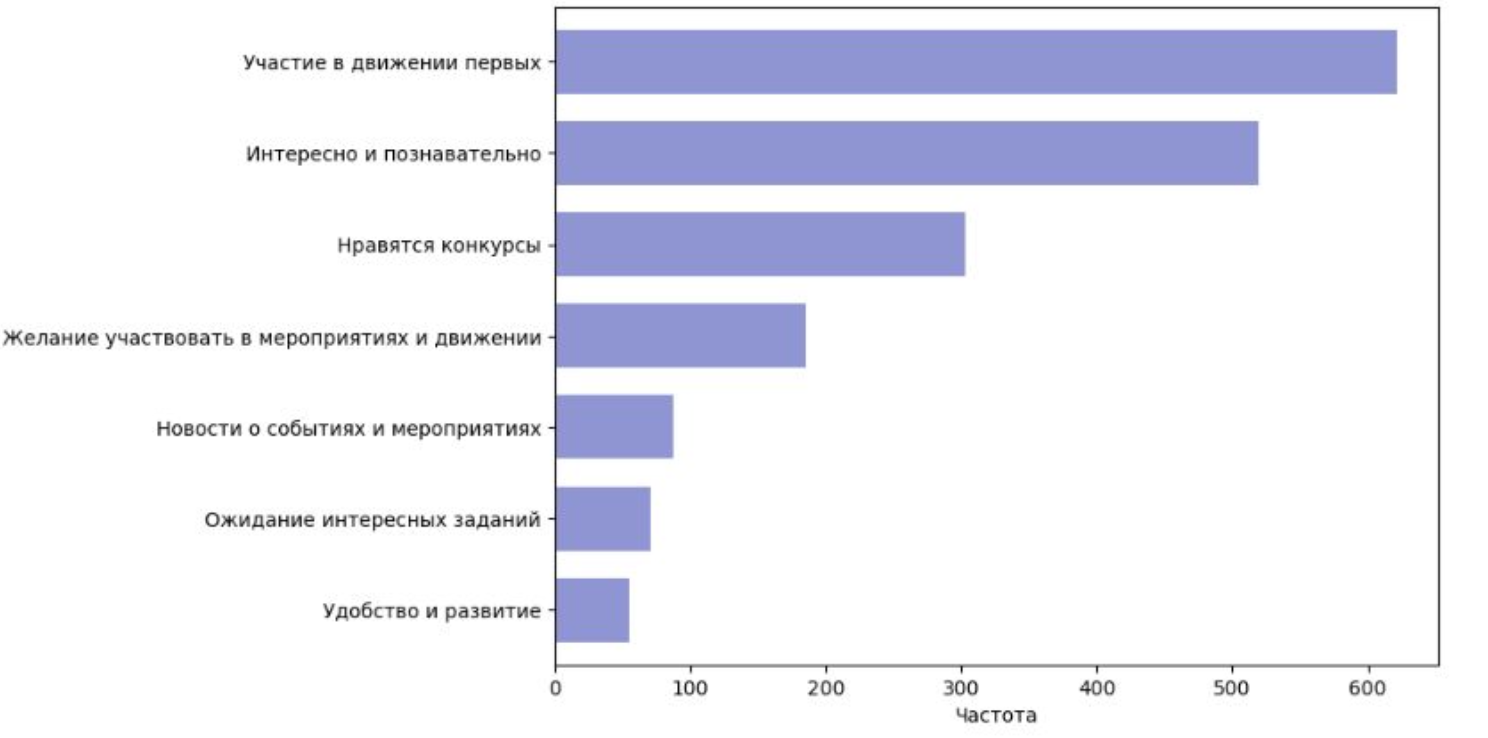
Research and rollout board
A preserved visual artefact representing how research, opportunity framing, and launch preparation were documented.
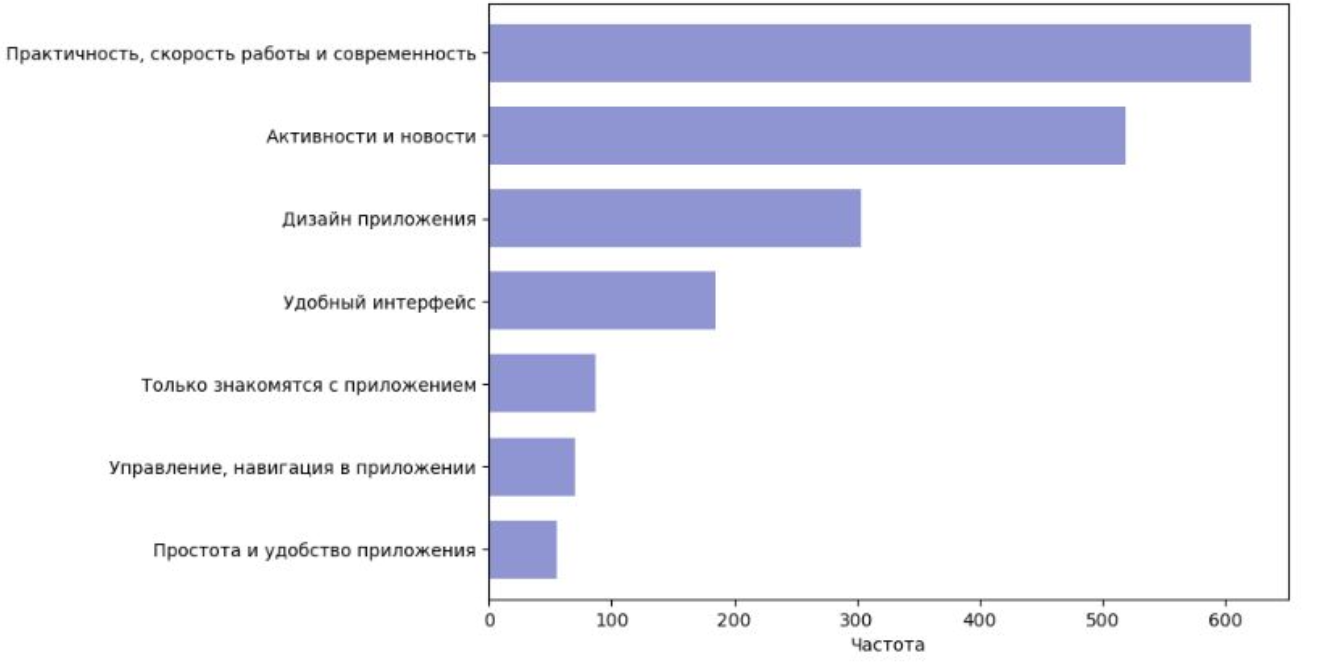
Product structure snapshot
A product-facing screen used to retain the visual language of the original case while showing the experience in context.
Implementation proof
a representative view for the launch and measurement layer that followed the initial design and pilot work.
Results
The product worked because the rollout model worked
The outcome was not just a better-looking educational game. It was a clearer school adoption model with measurable engagement growth, retention, and feedback quality.
What the case delivered
- 1,500 users in the first 3 months after launch, outperforming the initial acquisition target.
- Average time spent in the product increased by 30%, exceeding the planned +20% benchmark.
- Strong retention after launch: 65% on Day 7 and 45% on Day 30.
- Teacher NPS reached +35 and student CSAT reached 4.5/5.
- 5-school pilot and about 300 students provided real-world validation before wider rollout.
Operational takeaway
The redesign worked because it treated the product as a system: classroom use cases, teacher enablement, school buy-in, and analytics were designed together instead of in separate tracks.
45+
Stakeholder interviews across administrators, teachers, and parents.
200+
Student survey responses informing mechanics and experience priorities.
1 year
From discovery and backlog strategy through launch, pilots, and analytics.